

See the rush coming
Compare any week with the one before, and know when to bring on the extra crew.
Ask Pagecloud AI where visitors came from or how this month compared, and get a clear answer from your own analytics.

Picture a landscaping crew in Ottawa. Between jobs, the owner asks Pagecloud AI how the website is doing.
Compare any week with the one before, and know when to bring on the extra crew.
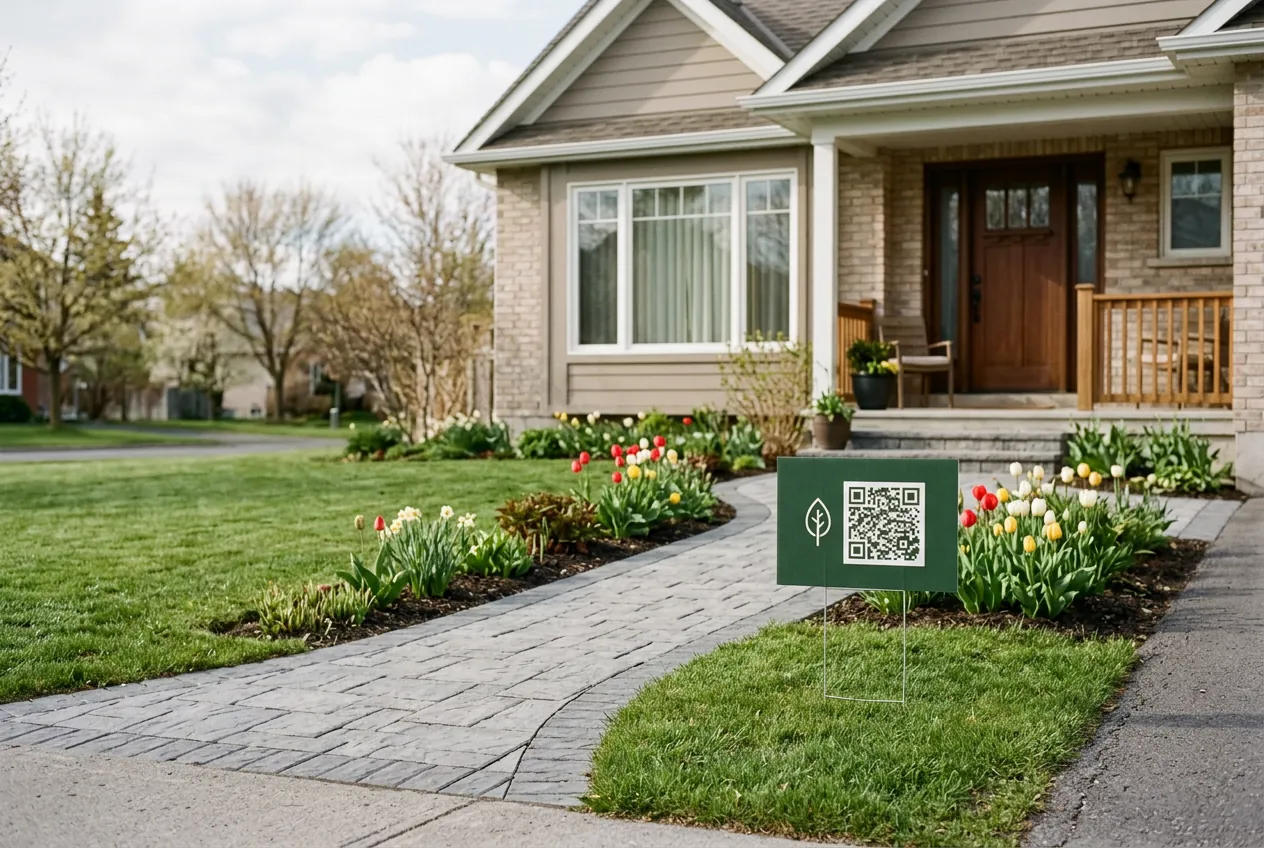
Search, a neighbor’s post or the sign on a finished lawn. See what sends visitors your way.

See which services people are reading about, so you can plan crews and order materials.

See which cities and regions your visitors come from, and plan your service area around them.
Prefer to look for yourself? The dashboard shows visitors, pages, where people came from and what they did, for any period you choose.
Your analytics
Get to know your visitors and optimize your page for better engagement.
Apr 13, 2026 to Apr 19, 2026based on local timezone
Custom rangeTotal visitors1,486↑ 42%
Page views4,210↑ 38%
Duration2m 12s↑ 14s
CurrentPrevious
Form submissions27↑ 11Submissions across all forms
Button clicks168↑ 52Clicks on button components
Top pages
PageViewsChange
/ (home page)1,318↑ 402
/interlock-patios612↑ 244
/patio-repair488↑ 196
/request-a-quote341↑ 128
/retaining-walls226↓ 12
Channels
ChannelVisitsChange
search682↑ 214
direct401↑ 98
social214↑ 87
referrer152↑ 41
internal37↓ 3
The full picture is there when you want it, organized around the questions owners ask.

This April against last April, or this week against the last. Choose a range and see how it stacks up.
No reports to dig through. Type a question and get a plain answer, right from your analytics.
Choose the region you serve and see it broken down further, so you know how much of your traffic comes from close to home.

Know which networks send people to your site, from a Facebook post to a Pinterest board.
Tag the links in your newsletters, promotions, ads and landing pages. Then filter all your analytics by one campaign and see what those visitors did.
Build your site with Pagecloud AI, then ask it anything about your visitors.
Create your websiteFree to start.